Whenever looking for information on IQ and IQ distribution in the population, one comes across a bell-shaped graph. If you are looking for a simple explanation for the connection between IQ and the bell curve, you have come to the right place. The graph can be easily understood without complicated words and formulas.
If you are proficient in statistics and mathematics or are interested in the history of the curve, you will find an excellent explanation on Wikipedia at this link.
In this article, we will explain in simple terms what the bell curve is, or in its official names the normal distribution curve, or the Gaussian curve. Also, we will explain what IQ is and how it relates to the bell curve.
What is the bell curve?
The bell curve is one type of many types of distributions, but it is important to know it because many research topics are distributed in this way. The bell curve is the most common graph in the world, so it is important to understand it.
This curve is so named because the shape it creates looks like a bell. There are several common names for this curve such as - the normal distribution, or the Gaussian curve (named after Carl Friedrich Gauss).
The graph describes the scattering of events on a particular axis. One of the reasons the graph is so common is its predictive power. This amazing graph accurately predicts many phenomena from everyday life.
An interesting example:
Imagine that you are measuring the height of all the people in your city (adults). You Collect the results and create a histogram (a type of graph). The X-axis represents the height of the people, and the Y-axis the frequency (quantity) of the people. You will be surprised to find that you will most likely get a normal curve.
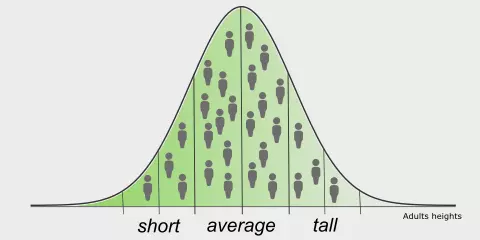
This graph is true for so many different areas of life. Distribution of the shoe sizes, price of shares on the stock market, or the distribution of baby weights born in a year.
What are the uses of the bell curve?
The bell curve is everywhere. This statistical distribution predicts cases in biology, psychology, mathematics and physics. Whatever field you can think of - it probably has a use for the bell curve.
Here are some real examples of the emergence of the normal distribution in nature and everyday life:
- Sum of 2 dice, normally distributed when 7 has the highest chance (16.67%)
- The height of the trees, and the extent of their trunk
- distribution of errors in measurements
- distributions of summer temperatures
- IQ distribution in the population
What is an IQ score?
Before linking the bell curve to IQ, we will define what exactly IQ is. An intelligence quotient is defined as the amount of intelligence of a particular person, relative to the rest of the population.
The most common and accurate tool for determining IQ is the IQ test. Various IQ tests (Stanford-Binet, Wechsler, and others) examine various aspects of the examinee's intelligence, such as analytical abilities, problem-solving, memory, spatial perception, and more. Although IQ tests are criticized, they are still the most common and accurate tool for determining intelligence.
Usually, the test is limited in time. The purpose of the test is not to test the examinee's thinking ability under pressure and therefore the time frame is large so that the examinees can finish it all.
Upon completion of the test, the subject receives his IQ score. This score represents the examinee's intelligence in relation to the general population, and we will detail the indices below.
The relationship between the bell curve and IQ score
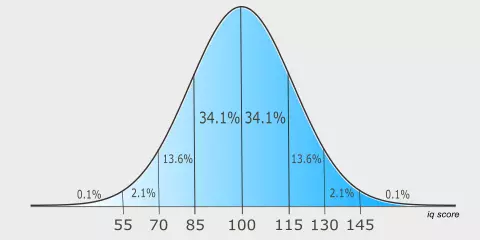
IQ scores in the population are distributed in the form of a bell - a normal distribution. The average and median score is 100, and all scores are symmetrically distributed on the graph. Therefore, half of the people in the population have an IQ above or equal to 100, and the other half below 100.
IQ bell curve with a standard deviation of 15 points. This means that about 68% of the population is in the range of 85 to 115 points. (15 points above 100, and 15 points below 100). If we look at a range of 2 standard deviations (30 points), we notice that about 95% of the population has an IQ between 70 and 130 points.
The remaining 5% are evenly distributed at the edges of the graph and are evenly spaced. IQ scores of 3 standard deviations from the average (above 145 or below 55) are very exceptional and in total constitute about 0.2% of the population.
To know the score of your IQ and the section where you are placed in the curve - take Brainalytics free IQ test.
What does my IQ score say about me?
The IQ scale can be divided into 7 parts:
For different IQ tests, the above ranges are slightly different from each other, but not significantly different.
There is no such thing as a good grade or a bad grade - the grades reflect your level of intelligence relative to the rest of the population.
To know if there is a direct link between success and high IQ we have written a special article for this topic: Does High Intelligence Predict Success?. In the article, it is indeed found and correlated between a high IQ and success in life.
No wonder people with a particularly high IQ have been linked to groundbreaking discoveries and inventions that have changed the face of humanity. Examples are Albert Einstein, Leonardo da Vinci, and Copernicus. In the list of the ten people with the highest IQ in history, there are anchors without whom we would not have reached where humanity is today.
However, of course, you can be successful even with a low IQ. There are a lot of celebrities with low iq. Muhammad Ali, Alonzo Clemons, Leslie Lemke, Andy Warhol, and lots of other examples, were the most successful people in the world in their field, with a particularly low IQs. In addition to almost any occupation you choose, you will find people who engage in the same job, with completely different IQs.
Conclusion
Some would say that the appearance of the bell graph, in so many areas of nature and science is magical. The IQ bell curve most accurately represents the IQ distribution in the general population. The world of science is still researching intelligence, and there are often discoveries about the human brain. Various theories and new studies are emerging that sometimes contradict each other, but it is good that in the meantime we have an excellent tool that allows us to measure the distribution of intelligence in the population.
Discover your accurate IQ, and take Brainalytics' free IQ test →
related topics

How is intelligence measured?